
School Year 2023-2024 (FY24) Archives
FY24 Summary
In FY24, eligible schools received the at-risk concentration allocation (first awarded by DC Council as part of the FY23 approved budget) through the Uniform Per Student Funding Formula (UPSFF) as part of initial school budget allocations. DCPS allocated Mayor’s Recovery Funds that stabilized schools to 95% of schools’ FY23 submitted budgets inclusive of local one-time funds received by the school, such as Schools First in Budgeting funds. Additionally, DCPS re-established the Budget Assistance process for FY24 budget development and made available a limited amount of funds for school leaders who identified extenuating circumstances that were unmet by their initial school budget allocation. Budget assistance allocations are one-time, single-year allocations.
The updated CSO and WTU contracts required that the respective members of these collective bargaining agreements be paid higher administrative premiums and additional compensation rates. Schools were not required to budget for the additional rates, which rose from $40/hour to $60/hour.
For FY24, as aligned to the Consumer Price Index (CPI) during a very high inflation period in the economy, DCPS increased the base amount of the “Custodial Supply” and “Total NPS allocation” lines to all schools by 7.5%.
After school budgets were submitted by Principals, but prior to the approval of the Mayor’s overall city budget, the DC Council enhanced the at-risk concentration funding, providing an additional $2.4M across eligible schools. Additionally, the DC Council allocated an additional $23.9M to schools identified as having a funding gap per the Schools First in Budgeting (SFIB) Act. Additional at-risk concentration and SFIB dollars were provided to schools as part of the approved budget and schools budgeted them over the summer as part of the summer reprogramming.
School Budget Data
Downloadable Spreadsheet
Download an Excel spreadsheet with the FY24 initial, submitted, and amended budgets broken into 3 tabs.
FY24 Initial, Submitted, and Amended Budgets
Worksheets
You can find FY24 Initial, Submitted, and Amended budget worksheets.
Power BI
You can find FY24 school budget data visualized through Microsoft Power BI here. Grants data here.
Budget Development Guide
Download the budget guide for FY24 development. Provides budgeting guidance and recommendations on allocations and programs included on school budgets.
How Schools Are Funded
DCPS’ School Funding Model distributes funds to schools based on their student and staff projections, with additional targeted support provided for students with greater need, while ensuring that schools are provided stability during year-over-year enrollment transitions. Funds are allocated in four distinct ways:
| Allocation Method | Description | Strategic Purpose |
| Student-Based Funds | Dollar allocation based on student enrollment and demographics. See Model Base Weights below. | Ensures that dollars follow students based on student need, promoting transparency and school empowerment |
| Staffing Ratios | Staff allocated based on enrollment | Ensures that essential services such as SPED and ML (formerly ELL) instruction are adequately resourced, leveraging the deep expertise of central office program teams |
| Program Grants | Staff or dollars allocated as grants for select programs or school attributes | Ensures that schools can afford signature programs and receive supplemental allocations for high student needs (e.g. IB funding, at-risk funding) |
| Stability Funds | Safety net checks and stabilization funds to protect schools from fluctuating enrollment | Ensures that schools, despite year-to-year enrollment changes, can meet unique demographic and programmatic needs, in line with DCPS’ north star of excellence |
FY24 Model Base Weights (Student-Based Funds)
| Category | Description | Weight | Weight Amount |
| Base Amount | Provided for each non-PK student | 1.0 | $6,473 |
| Early Childhood Education | Provided for each PK-3 and PK-4 student | 0.3 | $1,942 |
| K-8 Education Campus | Provided for each K-8 student at Education Campuses | 0.25 | $1,618 |
| English Language Learner | Provided for each student designated as English Language Learner | 0.3 | $1,942 |
| Special Education | Provided for each student receiving special education services | 0.3 | $1,942 |
| At-Risk greater than 40% | Provided for number of students above 40% of at-risk compared to total enrollment | 0.2 | $1,295 |
| At-Risk Secondary greater than 70% | Provided for number of grade 6-12 students above 70% of at-risk compared to total enrollment | 0.2 | $1,295 |
| Early Learning Center (ELC) | Provided for each student at Military Road and Stevens Early Learning Center | 0.85 | $5,502 |
| Special Education Campus | Provided for each student at River Terrace Special Education Campus | 0.45 | $2,913 |
FY24 Staffing Ratios
| Staff | Ratio | Additional Information |
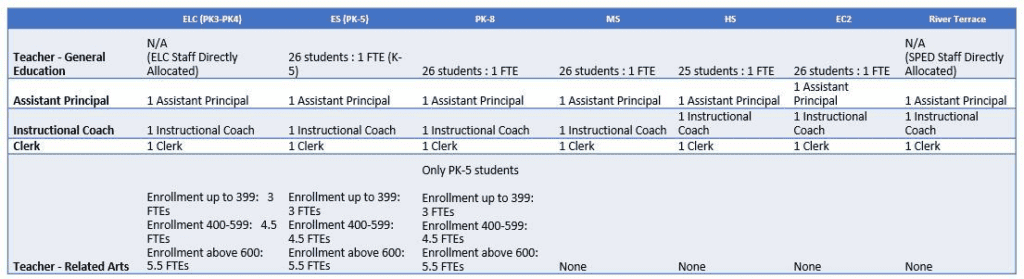
| Principal | 1 at every school | Exceptions: Military Road, Stevens ELC, McKinley MS & McKinley Tech HS, Peabody ES, Watkins ES |
| Early Childhood Education | 1 teacher and 1 aide for every 16 PK3 students and 20 PK4 students | 1 teacher and 1 aide for every 17 students in Mixed Age (PK3/PK4) classrooms |
| English Language Learners | 1 teacher for every 22 ELL students; 0.5 teacher for 11-16 ELL students. Secondary schools receive 1.0 ELL teachers if between 11-16. | 1 aide allocated for every 50 ELL Level 1 students |
| Special Education Staff | Staff allocated based on programmatic need | See budget guide for more information |
| School Counselors | 1 for every 400 middle school student, 1 for every 250 high school student | Allocations are rounded up to the nearest 0.5 (e.g., a middle school with 600 students receives 1.5 Guidance Counselors) |
| Librarians | 1 at every school | 1 additional at Columbia Heights EC and Oyster-Adams EC to cover each library building |
| Psychologists & Social Workers | Staff allocated based on programmatic need | See budget guide for more information |
| Custodial Staff & Supplies | 1 Foreman, 1 RW-5, and 1 RW-3 at every school | Additional RW-3s allocated based on school enrollment and square footage. |
FY24 Program Grants
| Program Grant | School Type | Allocation Methodology |
| Afterschool (Title IV-B funded) | Select Title I ES and K-8 Schools | Administrative Premium funds are allocated based on the number of seats available in the program. Seats are determined based on prior year after-school enrollment and attendance, demand for additional seats, and the capacity of a school program provider to serve additional students. |
| At-Risk UPSFF (including Overage at HS) | All Schools | DCPS allocates 90% of the at-risk UPSFF grant amount allocated to the district. Schools receive a per pupil dollar allocation for every at-risk student projected based on the UPSFF allocation to DCPS. |
| At-Risk UPSFF Concentration | Schools above 40% at-risk | Schools with at least 40% at-risk students projected receive a per pupil amount that is 7% of the UPSFF base amount for each student over 40%.Schools with at least 70% at-risk student projected receive an additional 7% of the UPSFF base amount for each student over 70%.This is additive for schools with at least 70% at-risk students projected. In total, they receive 14% of the UPSFF base amount for each student over 70%. |
| CTE & NAF | Select High Schools | CTE teachers are allocated to high schools so they may maintain programming.NAF personnel are allocated based on the needs and size of the schools’ NAF academies. |
| Credit Recovery | Select High Schools | Funding allocations are based on size of school, number of failures and anticipated course recovery needs, and program and funding usage during the prior year. |
| Dual Language | Select Schools | Schools are allocated per-pupil dollar amounts based on the number of ML and At-Risk ML students. The amounts are different between “1-way” and “2-way” programs. See the budget guide for more information. |
| Global Studies | Select Schools | Global studies schools are allocated 1 Coordinator and $3,000 in non-personnel dollars for programming. |
| International Baccalaureate (IB) | Select Schools | Schools are allocated 1 Coordinator per program and varying amounts of non-personnel dollars for the program depending on their programmatic need for PD, subscriptions etc. |
| JROTC (DoD funded) | Select High Schools | Schools are allocated 2 JROTC instructors to lead programming. |
| Pool Programming | Select Schools | High Schools with pools used for DCPS pool programming, Marie Reed, and River Terrace are allocated required Aquatic teachers and specialists, the funds required for the MOU with DPR, and supply funds.Schools part of the Grade 3 swim programming are allocated a locked lump sum of dollars that pays for the cost of transportation to the pools, required aquatics staff, and supplies. |
| Ninth Grade Academy (Title I funded) | Select Title I High Schools | Schools are allocated a Ninth Grade Academy Assistant Principal and administrative premium and non-personnel dollars relative to their size to fund the academy. |
| Reading Specialists (Title I Funded) | Select Elementary Schools | CW Harris, Langley, Moten, Patterson, Stanton, and Thomas are allocated one Title I funded Reading Specialist. |
| Safe & Positive Schools | Select Middle and High Schools | Schools who were approved for the Safe and Positive pilot program in SY21-22 will continue to receive this funding. In FY25, it is 75% of schools’ FY24 allocation. |
| School Office Support | All Schools | All schools receive flexible funding in the amount equal to the position cost of an administrative aide. |
| Specialty Payments | Select Schools | Brookland (arts),Banneker, SWS HS, Ellington (Specialty HS)Coolidge, Bard (Early College Partnership)McKinley Tech HS |
| Title I Schoolwide & Parental Involvement | Title I Schools | Title I schools receive a per-pupil amount of funding based on their eligibility percentage (schoolwide) and projected enrollment (Title I parental involvement). Title I schools do receive Title II dollars, but it is combined with Title I as part of their Schoolwide allocation. The per pupil is determined based on the overall expected grant award. |
| Title II | Non-Title I Schools | Title II funds are allocated to non-Title I schools as a per-pupil amount based on projected enrollment. The per-pupil is determined based on the overall expected grant award. |
| Total Non-Personnel Services Funds | All Schools | Schools receive a per-pupil dollar amount for every student in the projected enrollment. From this allocation, the school’s contribution to the library MOU is locked and individual overtime and administrative premium budgets are pre-budgeted based on historical spending trends. |
| Twilight (Title I Funded) | Select Title I High Schools | Schools are allocated administrative premium to pay teachers to staff the program. The exact amount of funding available to each school is determined based on past funding usage and projected student need. Students may enroll in Twilight sessions at another school that is not their home school. |
FY24 Stability Funds
Safety Net Supplement
The safety net supplement is provided to schools when the student-based funds do not generate enough dollars to provide a baseline of services by school type. The model calculates the cost of the baseline services at every school based on the individual school’s enrollment and school type. If the amount of student-based funding generated by a school is not enough to afford the safety net, then a school is allocated a “safety net supplement” which is the amount of funding a school would need to afford their safety net. Safety net funds are fully flexible.
Stabilization
Schools receive stabilization funding to maintain an initial allocation amount that is no less than 95% of their prior year submitted budget. In FY24, stabilization was calculated using schools’ FY24 formulaic budget and comparing it to their FY23 submitted budget (March 2022) excluding any one-time funding. Additionally, DCPS allocated Mayor’s Recovery Funds that stabilized schools to 95% of schools’ FY23 submitted budgets inclusive of local one-time funds received by the school, such as Schools First in Budgeting funds. These funds are fully flexible and can be used at the principals’ discretion to budget for staff and programming at the school.
Item Catalog
Below is a list of all school-based positions with their costs. Please note that you reach the unit cost by adding together the salary & benefits and administrative add-ons. See the following Administrative Add-ons by Union section to understand their composition.
| Positions | Salary & Benefits | Administrative Add-ons | Unit Cost |
| WTU 10mo (includes teachers) | $109,590 | $5,572 | $115,162 |
| WTU 11mo | $121,788 | $5,572 | $127,360 |
| WTU 12mo | $131,033 | $5,572 | $136,575 |
| Administrative Officer | $102,038 | $3,345 | $105,383 |
| Afterschool Coordinator | $101,311 | $3,345 | $104,656 |
| Aide – Administrative | $67,507 | $3,146 | $70,653 |
| Aide – Computer Lab | $61,168 | $3,146 | $64,314 |
| Aide – Instructional – Year Round (80hr) | $43,121 | $3,146 | $46,267 |
| Aide – Library/Technology | $46,742 | $3,146 | $49,888 |
| Aides, Instructional (10mo) | $35,765 | $3,146 | $38,911 |
| Assistant – Strategy & Logistics (ASL) | $65,547 | $3,146 | $68,693 |
| Assistant Principals | $154,709 | $3,345 | $158,054 |
| Athletic Director | $144,935 | $3,345 | $148,280 |
| Attendance Counselor | $64,564 | $4,667 | $69,231 |
| Behavior Technician | $52,924 | $3,146 | $56,070 |
| Business Manager | $89,239 | $3,345 | $92,584 |
| Clerk | $48,998 | $3,146 | $52,144 |
| Coordinator, Computer Lab/Technology and Parent | $58,586 | $3,071 | $61,657 |
| Coordinator – In-School Suspension (ISS) | $67,340 | $3,146 | $70,486 |
| Coordinator – Strategy & Logistics (CSL) | $98,479 | $3,345 | $101,824 |
| Custodial Foreman | $73,818 | $4,667 | $78,485 |
| Custodian (RW-3) | $47,562 | $4,667 | $52,229 |
| Custodian (RW-5) | $54,604 | $4,667 | $59,271 |
| Dean of Students | $115,740 | $3,345 | $119,085 |
| Directors | $144,935 | $3,345 | $148,280 |
| Program Coordinators | $115,088 | $3,345 | $118,433 |
| Program Managers | $126,720 | $3,345 | $130,065 |
| Registrar | $53,814 | $3,146 | $56,960 |
| Residency, Urban Teacher | $35,765 | $3,146 | $38,911 |
| Resident, Relay Teacher | $35,765 | $3,146 | $38,911 |
| Restorative Justice Coordinator | $102,038 | $3,345 | $105,383 |
| Specialist – Transition | $115,088 | $3,345 | $118,433 |
| Teacher – Vocational Ed (12mo) | $90,015 | $5,572 | $95,587 |
Administrative Add-Ons by Union
DCPS added the costs of certain expenses related to each union (e.g., the Washington Teachers’ Union, or WTU; Teamsters) and/or position type to the average salary and benefits. These additional costs are called “hold outs” or “add-ons.” For example, each teacher receives a $250 teacher supply card to purchase classroom supplies as part of the WTU contract. This $250 is added on top of the salary and benefits of every WTU position that is budgeted. Other examples of these add-on items include the costs of employee fingerprinting, ensuring compliance with disability accommodations required by the Americans with Disabilities Act (ADA), and cost of IMPACT teacher performance bonuses. All item costs are combined into one “add-on.” The total add-on cost varied based on position type since the expenses paid for can differ by union. The total “add on” budget was centrally managed.
| FY24 WTU Add-Ons | |||
| Description | Line Item | FY24 Cost per WTU | FY24 Budget |
| Mutual Consent Excessing Options | Extra Year Option | $58 | $316,800 |
| Mutual Consent Excessing Options | Buyout Option | $5 | $25,000 |
| IMPACT Bonuses | IMPACT Bonuses | $2,585 | $21,925,000 |
| Background Checks | Drug & Alcohol Testing | $27 | $225,750 |
| Background Checks | Fingerprinting Screen | $57 | $480,500 |
| Background Checks | Fitness for Duty/FMLA Verification | $3 | $22,712 |
| Employee Support | Start-Up Supplies | $200 | $1,070,800 |
| Employee Support | ADA Accommodations | $59 | $496,950 |
| Employee Support | WTU Tuition Reimbursement | $15 | $80,000 |
| Employee Support | International Visas | $5 | $27,000 |
| Employee Support | Employee Assistance Services | $11 | $94,500 |
| Stipends | DINR Bonus | $41 | $225,000 |
| Stipends | Department Chair Stipends | $101 | $550,000 |
| School-Based Costs | New Educator Pipeline | $46 | $250,000 |
| School-Based Costs | Placements | $363 | $1,972,140 |
| School-Based Costs | Substitutes | $1,481 | $8,041,000 |
| School-Based Costs | Enrollment Reserve | $330 | $2,800,000 |
| School-Based Costs | Backfill | $184 | $1,000,000 |
| Add-Ons | $5,572 | ||
| Base Salary | $94,474 | ||
| Salary and Benefits | $109,590 | Benefits Rate = 16.0% of Salary | |
| Total Average Teacher Cost | $115,162 | ||
| FY24 AFSCME Add-Ons | ||
| Description | FY24 Cost per AFSCME | FY24 Budget |
| IMPACT Bonuses | $2,585.50 | $21,925,000 |
| Drug & Alcohol Testing | $26.62 | $225,750 |
| Fingerprinting Screen | $56.66 | $480,500 |
| Fitness for Duty/FMLA Verification | $2.68 | $22,712 |
| ADA Accommodations | $58.60 | $496,950 |
| Employee Assistance Services | $11.14 | $94,500 |
| Enrollment Reserve | $330.19 | $2,800,000 |
| Legal Fund | $28.74 | $50,000 |
| Metro Pass | $45.98 | $80,000 |
| Total Add-ons | $3,146 | $26,175,412 |
| FY24 CSO Add-Ons | ||
| Description | FY24 Cost per CSO | FY24 Budget |
| IMPACT Bonuses | $2,585.50 | $21,925,000 |
| Drug & Alcohol Testing | $26.62 | $225,750 |
| Fingerprinting Screen | $56.66 | $480,500 |
| Fitness for Duty/FMLA Verification | $2.68 | $22,712 |
| ADA Accommodations | $58.60 | $496,950 |
| Employee Assistance Services | $11.14 | $94,500 |
| Enrollment Reserve | $330.19 | $2,800,000 |
| Professional Development | $73.96 | $50,000 |
| Start-Up Supplies | $200.00 | $153,200 |
| Total Add-ons | $3,345 | $26,248,612 |
| FY24 Teamsters Add-Ons | ||
| Description | FY24 Cost per Teamster | FY24 Budget |
| IMPACT Bonuses | $2,585.50 | $21,925,000 |
| Drug & Alcohol Testing | $26.62 | $225,750 |
| Fingerprinting Screen | $56.66 | $480,500 |
| Fitness for Duty/FMLA Verification | $2.68 | $22,712 |
| ADA Accommodations | $58.60 | $496,950 |
| Employee Assistance Services | $11.14 | $94,500 |
| Enrollment Reserve | $330.19 | $2,800,000 |
| Transportation | $33.00 | $20,000 |
| Shift Differential | $1,479.90 | $896,822 |
| Home Assistance | $82.51 | $50,000 |
| Total Add-ons | $4,667 | $26,985,234 |
Agency Budget Data
DCPS FY24 Budget Breakdown by Fund Source
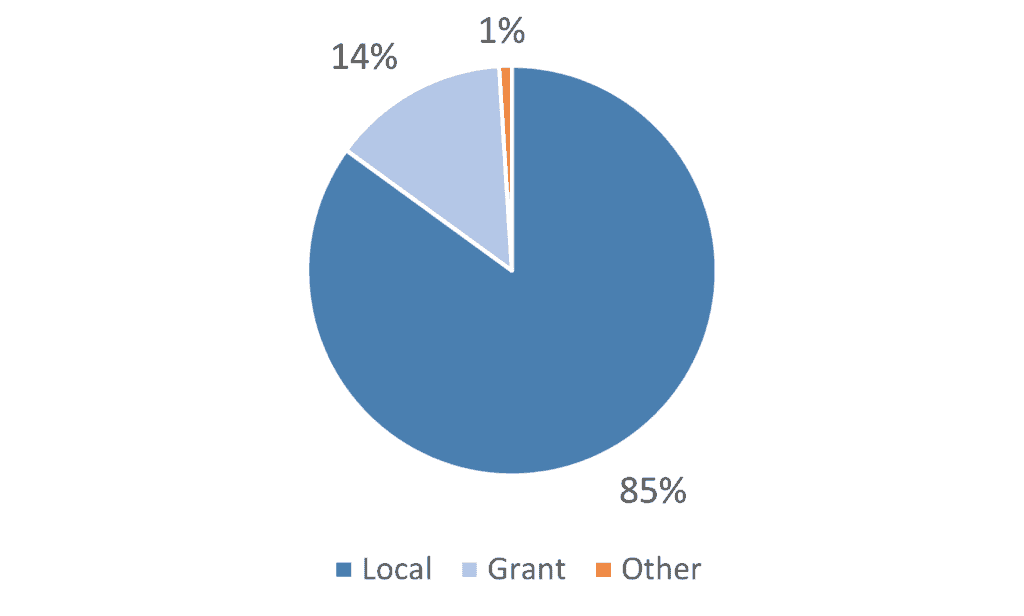
DCPS received the majority of its funding (85%) from local DC revenue through the Uniform Per Student Funding Formula (UPSFF) and local recovery funding in FY24. The local funding provided through the UPSFF was driven by enrollment projections as well as the UPSFF foundation weight and special populations weights.
In addition, 14 percent of DCPS’ agency budget consisted of intra-district grants and federal grants. Examples of intra-district grants from partner agencies include Titles I-IV (under the Elementary and Secondary Education Act, as amended by the Every Student Succeeds Act) and funding for the Individuals with Disabilities Education Act (IDEA).
A smaller portion (less than 1%) of funding came from donations and private sources.
The FY24 budget was the fourteenth consecutive year the school district’s budget increased funding for schools. In the budget process, DCPS focused on prioritizing programs closest to schools.
In FY24, DCPS budgeted:
$1.11 billion, or 79% of its operating budget, in school budgets and school-based services and positions on the central budget. This is comprised of:
- Individual school budgets as submitted by school leaders.
- School-based Services and Personnel: A large share of Central Office investments are fully school-based. Some examples include Athletic Trainers at high schools, Food Service workers, itinerant teachers supporting Multilingual learners at schools with fewer than 11 Multilingual learner students, and related service providers for students with disabilities, such as social workers and psychologists.
$251.0 million, or 18% of its operating budget in school supports.
- These are centrally budgeted funds that supported functions such as curriculum and instruction, and logistics and operations, including transportation contracts.
$36.1 million, or 3% of its operating budget, on central administration.
- These funds supported district functions such as human resources, procurement, general counsel, and financial administration.
Key Central Allocations
Several significant expenditures were budgeted and managed centrally on behalf of schools for FY24, including:
- Food Services: $67 million to operate the school nutrition program to ensure students receive healthy meals.
- Building Maintenance: $52 million for school campus maintenance costs, including electricity, gas, and water.
- Information Technology: $55 million for technology, data systems, and technology support for DCPS students and staff.
- Related service providers: $35 million for staff who provide services for students with disabilities. The budget for audiologists, occupational therapists, physical therapists, speech language pathologists, and speech therapists, among others, was managed centrally because these employees served students across multiple schools.