
School Year 2022-2023 (FY23) Archives
FY23 Summary
In FY23, DCPS began using its updated funding model, which combines components of the previous comprehensive staffing model with student-based budgeting (SBB) to better ensure that ‘money follows the student.’ SBB provides funds via a per pupil dollar amount based on student enrollment and demographics.
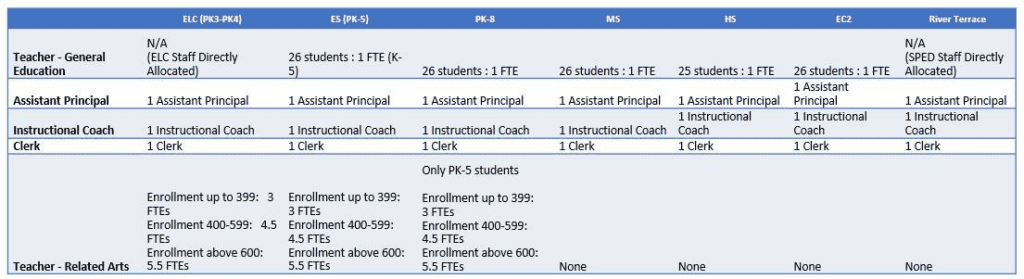
The updated funding model provided fewer direct staffing allocations to schools and instead provided allocations of discretionary dollars based on projected student demographics (student based budgeting) as well as the direct allocation of the UPSFF at-risk grant. For example, the following items were no longer direct allocations, and Principals used their flexible dollars to include in their budgets: general education & related arts teachers, Assistant Principals, Instructional Coaches, and Kindergarten aides. This shift in allocations also allowed DCPS an opportunity to better align allocation flexibility levels (L1-L3) to be more specific and transparent to community and school leaders. In light of the pandemic, school received one-time stability funding called hold harmless and Mayor’s Recovery funds, which ensured that no school received less than their previous year initial allocation and maintained buying power for similar levels of staff and programming. Outside of their funding allocation, schools had the opportunity to apply for ESSER III funding to support acceleration programming and high impact tutoring. $6M of ESSER III funds were allocated to schools.
After school budgets were submitted by schools, but prior to the approval of the Mayor’s overall city budget, the DC Council established an additional funding source for DCPS schools, the At-Risk Concentration fund. These funds were provided to schools with a projected percentage of at-risk students more than 40% and additional funds to schools with a projected percentage over 70%. These funds (~$5.3M) were provided to schools as part of the approved budget and schools budgeted them over the summer as part of the summer reprogramming.
School Budget Data
Downloadable Spreadsheet
Download an Excel spreadsheet of the FY23 initial or submitted budget.
Worksheets
You can find FY23 Initial and Submitted budgets worksheets.
Power BI
You can find FY23 school budget data visualized through Microsoft Power BI here.
Budget Development Guide
Download the budget guide for FY23 development. Provides budgeting guidance and recommendations on allocations and programs included on school budgets.
How Schools Are Funded
DCPS’ new School Funding Model distributes funds to schools based on their student and staff projections, with additional targeted support provided for students with greater need, while ensuring that schools are provided stability during year-over-year enrollment transitions. Funds are allocated in four distinct ways:
| Allocation Method | Description | Strategic Purpose |
| Student-Based Funds | Dollar allocation based on student enrollment and demographics. See Model Base Weights below. | Ensures that dollars follow students based on student need, promoting transparency and school empowerment |
| Staffing Ratios | Staff allocated based on enrollment | Ensures that essential services such as SPED and ML (formerly ELL) instruction are adequately resourced, leveraging the deep expertise of central office program teams |
| Program Grants | Staff or dollars allocated as grants for select programs or school attributes | Ensures that schools can afford signature programs and receive supplemental allocations for high student needs (e.g. IB funding, at-risk funding) |
| Stability Funds | Safety net checks and stabilization funds to protect schools from fluctuating enrollment | Ensures that schools, despite year-to-year enrollment changes, can meet unique demographic and programmatic needs, in line with DCPS’ north star of excellence |
FY23 Model Base Weights (Student-Based Funds)
| Category | Description | Weight | Weight Amount |
| Base Amount | Provided for each non-PK student | 1.0 | $5,973 |
| Early Childhood Education | Provided for each PK-3 and PK-4 student | 0.3 | $1,792 |
| K-8 Education Campus | Provided for each K-8 student at Education Campuses | 0.25 | $1,493 |
| English Language Learner | Provided for each student designated as English Language Learner | 0.3 | $1,792 |
| Special Education | Provided for each student receiving special education services | 0.3 | $1,792 |
| At-Risk greater than 40% | Provided for number of students above 40% of at-risk compared to total enrollment | 0.2 | $1,195 |
| At-Risk Secondary greater than 70% | Provided for number of greade 6-12 students above 70% of at-risk compared to total enrollment | 0.2 | $1,195 |
| Early Learning Center (ELC) | Provided for each student at Military Road and Stevens Early Learning Center | 0.85 | $5,077 |
| Special Education Campus | Provided for each student at River Terrace Special Education Campus | 0.45 | $2,688 |
FY23 Staffing Ratios
| Staff | Ratio | Additional Information |
| Principal | 1 at every school | Exceptions: Military Road, Stevens ELC, McKinley MS & McKinley Tech HS, Peabody ES, Watkins ES |
| Early Childhood Education | 1 teacher and 1 aide for every 16 PK3 students and 20 PK4 students | 1 teacher and 1 aide for every 17 students in Mixed Age (PK3/PK4) classrooms |
| English Language Learners | 1 teacher for every 22 ELL students; 0.5 teacher for 11-16 ELL students. | 1 aide allocated for every 50 ELL Level 1 students. Secondary schools receive 1.0 ELL teachers if between 11-16. |
| Special Education Staff | Staff allocated based on programmatic need | See budget guide for more information |
| School Counselors | 1 for every 400 middle school student, 1 for every 250 high school student | Allocations are rounded up to the nearest 0.5 (e.g., a middle school with 600 students receives 1.5 Guidance Counselors) |
| Librarians | 1 at every school | 1 additional at Columbia Heights EC and Oyster-Adams EC to cover each library building |
| Psychologists & Social Workers | Staff allocated based on programmatic need | See budget guide for more information |
| Custodial Staff & Supplies | 1 Foreman, 1 RW-5, and 1 RW-3 at every school. Supplies are allocated based on square footage. | Additional RW-3s allocated based on school enrollment and square footage. High schools receive a base of 2 RW-3s |
FY23 Program Grants
| Program Grant | School Type |
| Afterschool | Select Title I Schools Serving grades K-8 |
| At-Risk UPSFF | All Schools |
| CTE & NAF | Select High Schools |
| Credit Recovery | Select High Schools |
| Dual Language | Select Schools |
| Global Studies | Select Schools |
| International Baccalaureate (IB) | Select Schools |
| JROTC | Select High Schools |
| Pool Programming | Select Schools |
| Ninth Grade Academy | Select Title I High Schools |
| Reading Specialists (Title Funded) | Select Elementary Schools |
| Safe & Positive Schools | Select Middle and High Schools |
| School Office Support | All Schools |
| Specialty Payments | Select Schools |
| Title I Schoolwide & Parental Involvement | Title I Schools |
| Title II | Non-Title I Schools |
| Total Non-Personnel Services Funds | All Schools |
| Twilight (Title Funded) | Select Title I High Schools |
FY23 Stability Funds
Safety Net Supplement
The safety net supplement is provided to schools when the student-based funds do not generate enough dollars to provide a baseline of services by school type. The model calculates the cost of the baseline services at every school based on the individual school’s enrollment and school type. If the amount of student-based funding generated by a school is not enough to afford the safety net, then a school is allocated a “safety net supplement” which is the amount of funding a school would need to afford their safety net. Safety net funds are fully flexible.
Stabilization
Stabilization funding is provided to schools as required by the Fair Student Funding and School-Based Budgeting Act of 2013, an amendment to the Uniform Per Student Funding Formula for Public Schools and Public Charter Schools Act of 1998. This Act requires DCPS to provide each school with no less than 95% of its prior year budget allocation as determined by the school funding allocation model. Stabilization funding provides schools buying power that would otherwise be lost due to declining enrollment or changing student demographics. In FY23, schools received one-time stability funding called hold harmless and Mayor’s Recovery funds, which ensured that no school received less than their previous year initial allocation and maintained buying power for similar levels of staff and programming.
Item Catalog
Below is a list of all school-based positions with their costs. Please note that you reach the unit cost by adding together the salary & benefits and administrative add-ons. See the following Administrative Add-ons by Union section to understand their composition.
| Positions | Salary & Benefits | Administrative Add-ons | Unit Cost |
| WTU 10mo (includes teachers) | $108,451 | $5,381 | $113,182 |
| WTU 11mo | $123,044 | $5,381 | $128,425 |
| WTU 12mo | $123,797 | $5,381 | $129,178 |
| Administrative Officer | $101,943 | $3,066 | $105,009 |
| Afterschool Coordinator | $98,285 | $3,066 | $101,351 |
| Aide – Administrative | $69,090 | $2,871 | $71,961 |
| Aide – Computer Lab | $61,937 | $2,871 | $64,808 |
| Aide – Instructional – Year Round (80hr) | $42,713 | $2,871 | $45,584 |
| Aide – Library/Technology | $49,583 | $2,871 | $52,454 |
| Aides, Instructional (10mo) | $36,295 | $2,871 | $39,166 |
| Assistant – Strategy & Logistics (ASL) | $68,573 | $2,871 | $71,444 |
| Assistant Principals | $155,494 | $3,066 | $158,560 |
| Athletic Director | $144,813 | $3,066 | $147,879 |
| Attendance Counselor | $66,416 | $4,256 | $70,672 |
| Behavior Technician | $54,687 | $2,871 | $57,558 |
| Business Manager | $89,320 | $3,066 | $92,386 |
| Clerk | $50,758 | $2,871 | $53,629 |
| Coordinator, Computer Lab/Technology and Parent | $56,289 | $2,786 | $59,075 |
| Coordinator – In-School Suspension (ISS) | $68,719 | $2,871 | $71,590 |
| Coordinator – Strategy & Logistics (CSL) | $98,114 | $3,066 | $101,180 |
| Custodial Foreman | $74,769 | $4,256 | $79,025 |
| Custodian (RW-3) | $46,931 | $4,256 | $51,187 |
| Custodian (RW-5) | $55,803 | $4,256 | $60,059 |
| Dean of Students | $117,401 | $3,066 | $120,467 |
| Directors | $144,813 | $3,066 | $147,879 |
| Program Coordinators | $116,417 | $3,066 | $119,483 |
| Program Managers | $128,710 | $3,066 | $131,776 |
| Registrar | $55,629 | $2,871 | $58,500 |
| Residency, Urban Teacher | $33,704 | $2,871 | $36,575 |
| Resident, Relay Teacher | $38,134 | $2,871 | $41,003 |
| Restorative Justice Coordinator | $101,943 | $3,066 | $105,009 |
| Specialist – Transition | $115,088 | $3,066 | $117,189 |
| Teacher – Vocational Ed (12mo) | $80,529 | $5,381 | $85,910 |
Administrative Add-Ons by Union
In addition to salary and benefits, DCPS added the costs of certain expenses related to each union (e.g., the Washington Teachers’ Union, or WTU; Teamsters) and/or position type to the average salary and benefits. These additional costs are called “hold outs” or “add-ons.” For example, each teacher receives a $250 teacher supply card to purchase classroom supplies as part of the WTU contract. This $250 is added on top of the salary and benefits of every WTU position that is budgeted. Other examples of these add-on items include the costs of employee fingerprinting, ensuring compliance with disability accommodations required by the Americans with Disabilities Act (ADA), and cost of IMPACT teacher performance bonuses. All item costs are combined into one “add-on.” The total add-on cost varied based on position type since the expenses paid for can differ by union. The total “add on” budget was centrally managed.
| FY23 WTU Add-Ons | |||
| Description | Line Item | FY23 Cost per WTU | FY23 Budget |
| Mutual Consent Excessing Options | Extra Year Option | $61 | $316,800 |
| Mutual Consent Excessing Options | Buyout Option | $4 | $20,000 |
| IMPACT Bonuses | IMPACT Bonuses | $2,440 | $19,400,000 |
| Background Checks | Drug & Alcohol Testing | $27 | $215,000 |
| Background Checks | Fingerprinting Screen | $57 | $450,000 |
| Background Checks | Fitness for Duty/FMLA Vertification | $3 | $21,630 |
| Employee Support | Start-Up Supplies | $200 | $1,040,800 |
| Employee Support | ADA Accommodations | $60 | $474,500 |
| Employee Support | WTU Tuition Reimbursement | $15 | $80,000 |
| Employee Support | International Visas | $4 | $20,000 |
| Employee Support | Employee Assistance Services | $11 | $90,000 |
| Stipends | DINR Bonus | $43 | $225,000 |
| Stipends | Department Chair Stipends | $106 | $550,000 |
| School-Based Costs | New Educator Pipeline | $48 | $250,000 |
| School-Based Costs | Placements | $377 | $1,962,496 |
| School-Based Costs | Substitutes | $1,545 | $8,041,000 |
| School-Based Costs | Enrollment Reserve | $189 | $1,500,000 |
| School-Based Costs | Backfill | $192 | $1,000,000 |
| Add-Ons | $5,381 | ||
| Base Salary | $93,171 | ||
| Salary and Benefits | $108,451 | Benefits Rate = 16.4% of Salary | |
| Total Average Teacher Cost | $113,832 | ||
| FY23 AFSCME Add-Ons | ||
| Description | FY23 Cost per AFSCME | FY23 Budget |
| IMPACT Bonuses | $2,349.64 | $19,400,000 |
| Drug & Alcohol Testing | $27.04 | $215,000 |
| Fingerprinting Screen | $56.59 | $450,000 |
| Fitness for Duty/FMLA Vertification | $2.72 | $21,630 |
| ADA Accommodations | $59.67 | $474,500 |
| Employee Assistance Services | $11.32 | $90,000 |
| Enrollment Reserve | $188.63 | $1,500,000 |
| Legal Fund | $32.81 | $50,000 |
| Metro Pass | $52.49 | $80,000 |
| Total Add-ons | $2,871 | $22,281,130 |
| FY23 CSO Add-Ons | ||
| Description | FY23 Cost per CSO | FY23 Budget |
| IMPACT Bonuses | $2,439.64 | $19,400,000 |
| Drug & Alcohol Testing | $27.04 | $215,000 |
| Fingerprinting Screen | $56.59 | $450,000 |
| Fitness for Duty/FMLA Vertification | $2.72 | $21,630 |
| ADA Accommodations | $59.67 | $474,500 |
| Employee Assistance Services | $11.32 | $90,000 |
| Enrollment Reserve | $188.63 | $1,500,000 |
| Professional Development | $80.65 | $50,000 |
| Start-Up Supplies | $200.00 | $124,000 |
| Total Add-ons | $3,066 | $22,325,130 |
| FY23 Teamsters Add-Ons | ||
| Description | FY23 Cost per Teamster | FY23 Budget |
| IMPACT Bonuses | $2,349.64 | $19,400,000 |
| Drug & Alcohol Testing | $27.04 | $215,000 |
| Fingerprinting Screen | $56.59 | $450,000 |
| Fitness for Duty/FMLA Vertification | $2.72 | $21,630 |
| ADA Accommodations | $59.67 | $474,500 |
| Employee Assistance Services | $11.32 | $90,000 |
| Enrollment Reserve | $188.63 | $1,500,000 |
| Transportation | $34.72 | $20,000 |
| Shift Differential | $1,348.65 | $776,822 |
| Home Assistance | $86.81 | $50,000 |
| Total Add-ons | $4,256 | $22,997,952 |
Agency Budget Data
DCPS FY23 Budget Breakdown by Fund Source
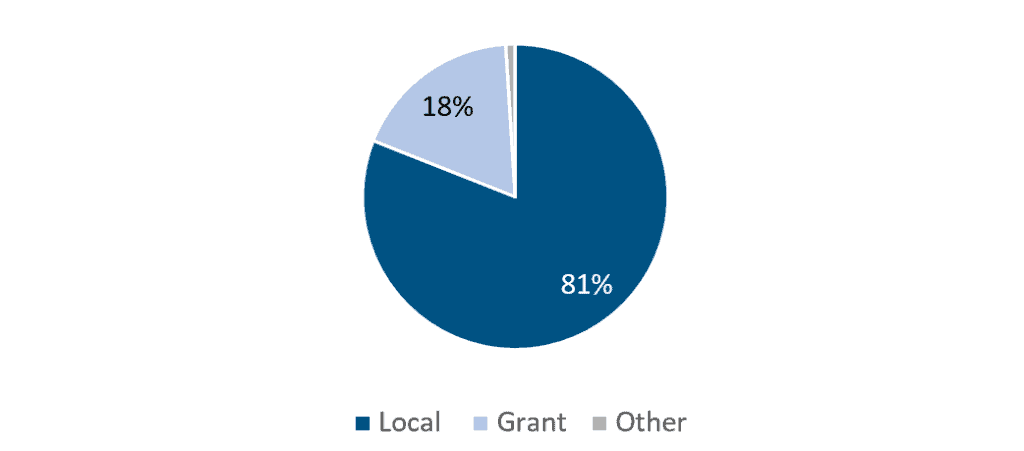
DCPS received the majority of its funding (81%) from local DC revenue through the Uniform Per Student Funding Formula (UPSFF) and local recovery funding in FY23. The local funding provided through the UPSFF is driven by enrollment projections as well as the UPSFF foundation weight and special populations weights.
In addition, 18 percent of DCPS’ agency budget consisted of intra-district grants and federal grants. Examples of intra-district grants from partner agencies include Titles I-IV (under the Elementary and Secondary Education Act, as amended by the Every Student Succeeds Act) and funding for the Individuals with Disabilities Education Act (IDEA).
A smaller portion (less than 1%) of funding came from donations and private sources.
The FY23 budget was the thirteenth consecutive year the school district’s budget increased funding for schools. In the budget process, DCPS focused on prioritizing programs closest to schools.
In FY23, DCPS budgeted:
$1.07 billion, or 79% of its operating budget, in school budgets and school-based services and positions on the central budget. This is comprised of:
- Individual school budgets as submitted by school leaders.
- School-based Services and Personnel: A large share of Central Office investments are fully school-based. Some examples include Athletic Trainers at high schools, Food Service workers, itinerant teachers supporting English learners at schools with fewer than 11 English learner students, and related service providers for students with disabilities, such as social workers and psychologists.
$247.7 million, or 18% of its operating budget in school supports.
- These are centrally budgeted funds that supported functions such as curriculum and instruction, and logistics and operations, including transportation contracts.
$36.2 million, or 3% of its operating budget, on central administration.
- These funds supported district functions such as human resources, procurement, general counsel, and financial administration.
Key Central Allocations
Several significant expenditures were budgeted and managed centrally on behalf of schools for FY23, including:
- Food Services: $63 million to operate the school nutrition program to ensure students receive healthy meals.
- Building Maintenance: $51 million for school campus maintenance costs, including electricity, gas, and water.
- Information Technology: $41 million for technology, data systems, and technology support for DCPS students and staff.
- Related service providers: $25 million for staff who provide services for students with disabilities. The budget for audiologists, occupational therapists, physical therapists, speech language pathologists, and speech therapists, among others, was managed centrally because these employees served students across multiple schools.