
Enrollment Projection Methodology
D.C. Public Schools’ enrollment projections are an estimate of enrollment at each school on October 5th of the subsequent school year. October 5th is the official enrollment audit date set by the Office of the State Superintendent for Education (OSSE). DCPS analyzes past enrollment trends to calculate total enrollment at each school, enrollment of students who receive special education services, enrollment of students who meet at-risk criteria, and enrollment of students who are Multilingual learners.
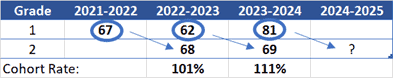
Grade Progression Ratio
Analysis includes a “grade progression ratio” (sometimes referred to as a “cohort-survival rate”) – a projection calculation commonly used by school districts. The grade progression ratio relies on at least three years of October 5th enrollment data to identify the average change in class size from one grade to the next.
In the example below, trends show that this school typically sees cohorts grow between first and second grade. In other words, cohorts are larger in second grade than they were when the students were in first grade. The grade progression ratio is greater than 100%.
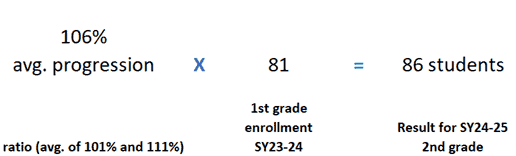
To estimate the size of the next second grade cohort, we multiply the size of the first-grade cohort by the average grade progression ratio:
Calculating enrollment projections relies on enrollment of past years. Knowing that SY21-22 may have been impacted by COVID-19, DCPS did make some adjustments to entry grades to assume slightly higher enrollment of new students.
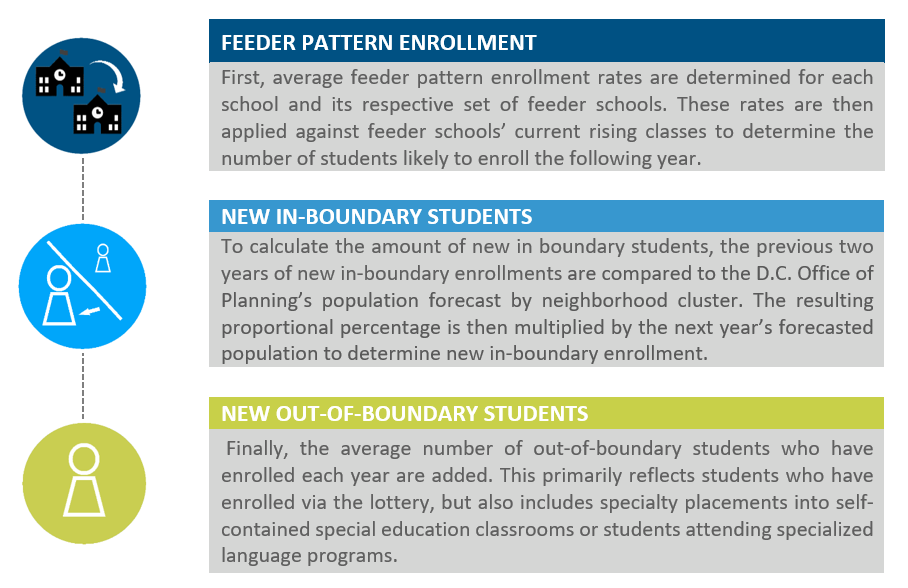
In entry grades (typically Kindergarten, 6th grade, and 9th grade), the process combines three factors to build a projection: feeder pattern enrollment, new in-boundary enrollment, and new out-of-boundary enrollment.
The final projection is compared to historical school trends to see if the class size reflects recent enrollment trends. Where a Kindergarten, 6th grade, or 9th grade projection significantly differs from a school’s recent trends, DCPS School Planning does additional review.
Early Childhood Projections
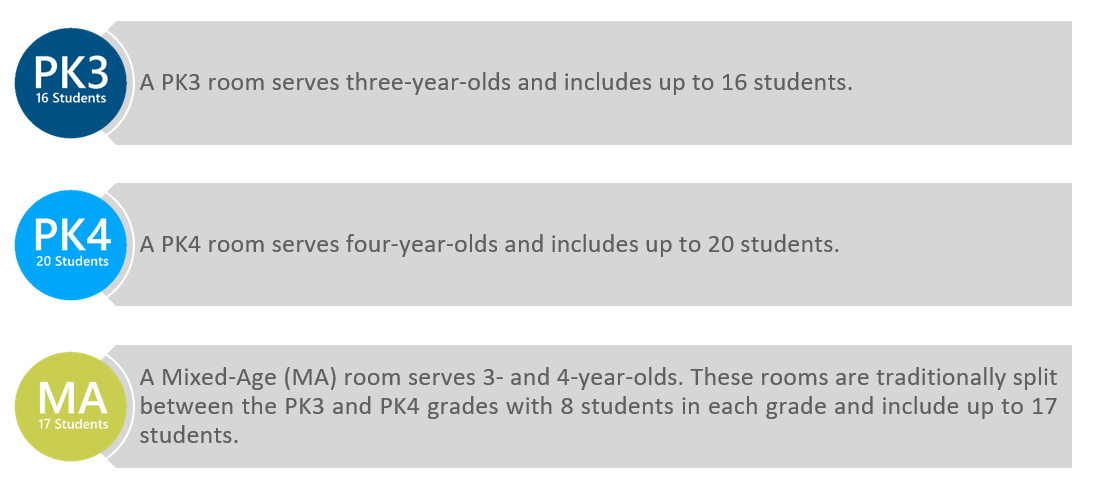
Early Childhood Education (ECE) classes are projected based on the number and types of classrooms each school offers. Each pre-kindergarten (PK) classroom is generally projected to reach its seat capacity, except for a few seats reserved for children with developmental needs who are placed through DCPS Early Stages.
ECE class sizes are regulated by D.C. Municipal Regulations and are specifically outlined in the circles below, along with our projection approach in each grey box:
Enrollment Projection Principal Review and Adjustment
Draft enrollment projections are made available to school principals and LSATs. Principals can submit petitions to change their total enrollment projection, Multilingual Learner (ML) projection, Special Education (SPED) projection, or at-risk projection. Petitions are reviewed with DPCS leadership and DCPS School Planning may recalculate a projection based on school feedback.
Specific programming changes are also reviewed at this time. The changes may include grade configuration changes, new or expanded programming, and temporary or permanent location changes, along with other place-based circumstances that may result in a smaller or larger class size by grade for the following school year.
Finally, each school’s enrollment projection is shared with its respective principal, Local School Advisory Team (LSAT), and instructional superintendent. Principals review and can propose changes to their projections. Any proposed change requires a written rationale, and all proposals are reviewed and considered. Upon review, a final decision is made to either accept or reject (in full or in part) a principal’s proposed changes. A rationale is provided to each principal based on their enrollment request. Once adjustments are finalized, final projections are shared with principals.